Counting the world | British foreign trade is accelerating de-Europeanization.
[Introduction] In 2023, the EU was still Britain’s largest trading partner, but since Brexit, the EU’s share of Britain’s total imports has dropped from 49.4% in 2019 to 40.6% in 2023, and its share of Britain’s total exports has dropped from 46.1% to 42.4%. It may be exaggerated to say that Britain is accelerating its "decoupling" from the EU, but the de-Europeanization of foreign trade is obvious. Relatively speaking, Britain’s exports to the United States, India, ASEAN and other countries have maintained growth. In addition, in December of that year, British foreign trade plummeted by 16%, especially the export to China dropped by 66.1%. This was actually caused by the fluctuation of precious metal trade such as gold, and related products accounted for 52% of British exports to China. The relationship between trade and finance surfaced again.
1. Overall trend analysis
In 2023, Britain’s import and export totaled US$ 1,312.16 billion, down by 3.3% year-on-year, of which US$ 100.37 billion was imported and exported in December, down by 16.0% year-on-year and 13.4% quarter-on-quarter (month-on-month), with an upward trend in the past 12 months.
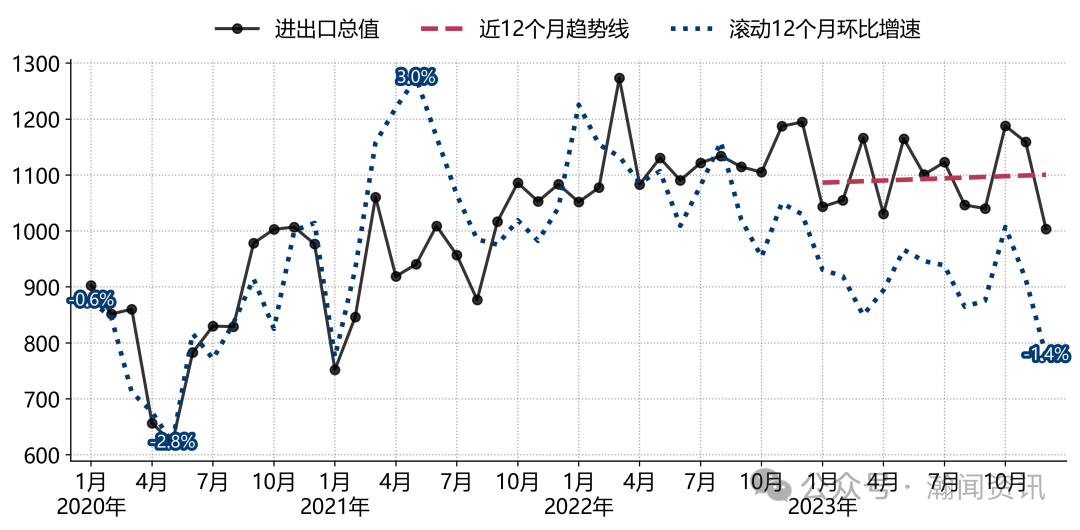
Figure 1 Trend of UK’s total import and export value from 2020 to December 2023 (USD 100 million)
Data sources: Eurostat (198801-201912), HM Revenue & Customs (202001-), Global Trade Watch (GTF) system of Hanwen Information.
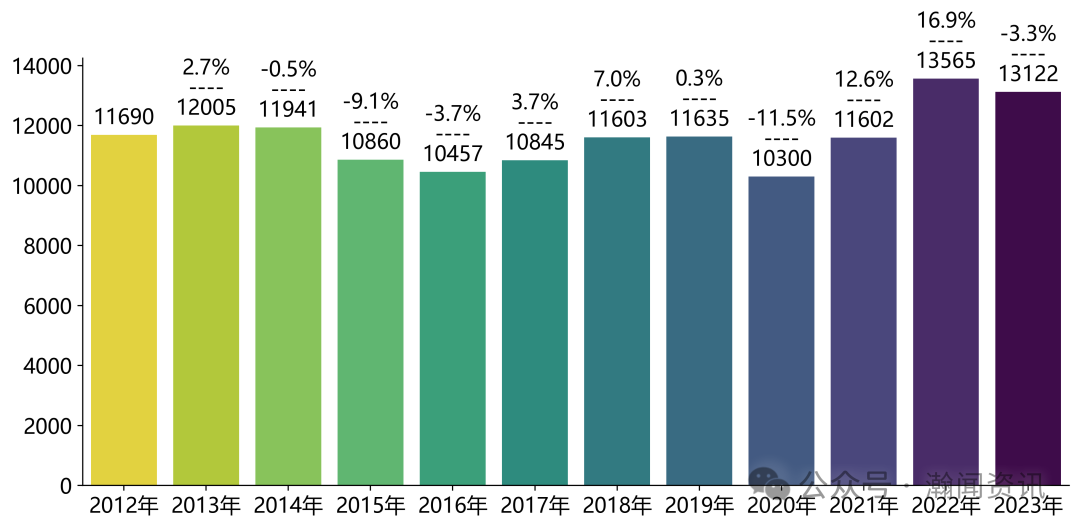
Figure 2 UK import and export amount and growth rate in December 2012-2023 (USD 100 million)
Data sources: Eurostat (198801-201912), HM Revenue & Customs (202001-), Global Trade Watch (GTF) system of Hanwen Information.
On a monthly basis, the import and export amount is generally lower than the same period last year.
Figure 3 Monthly amount and year-on-year growth rate of UK imports and exports from 2020 to 2023 (USD 100 million)
Data sources: Eurostat (198801-201912), HM Revenue & Customs (202001-), Global Trade Watch (GTF) system of Hanwen Information.
2. Structural analysis
According to the statistics of imports and exports, the import value of Britain in 2023 was 791.38 billion US dollars, down 3.9% year-on-year; The export value was US$ 520.78 billion, down 2.3% year-on-year.
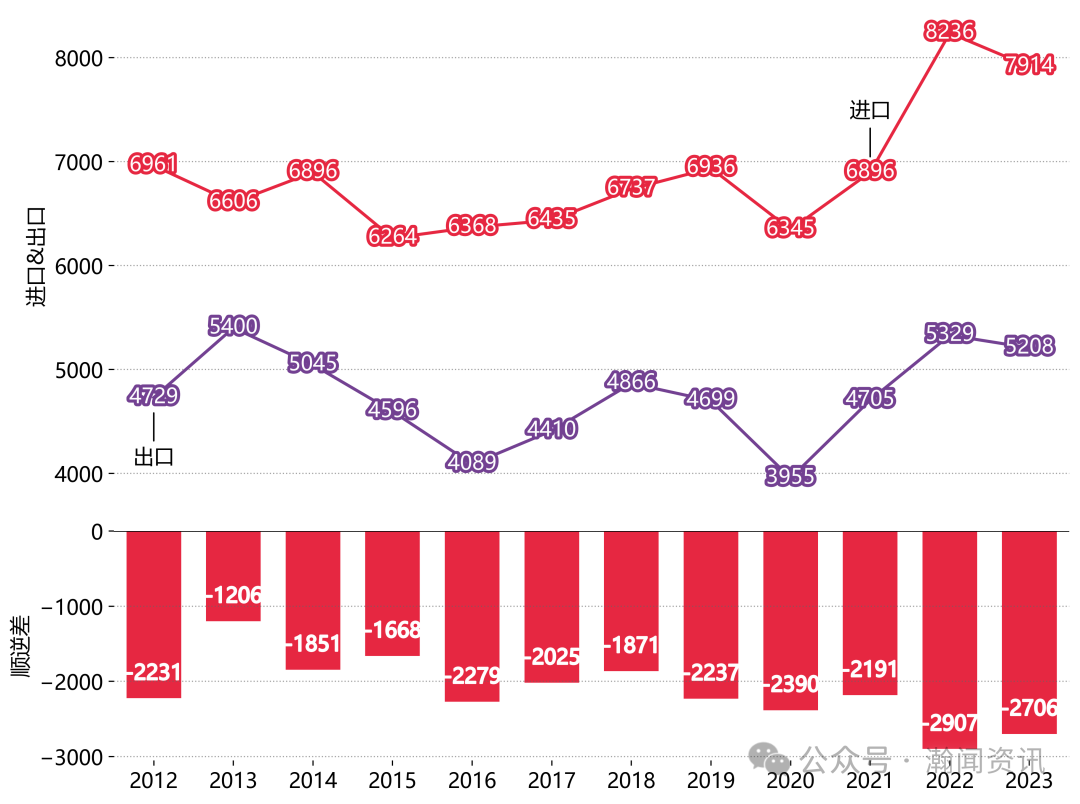
Figure 4 The trend chart of Britain’s import, export and surplus deficit in December 2012-2023 (USD 100 million)
Data sources: Eurostat (198801-201912), HM Revenue & Customs (202001-), Global Trade Watch (GTF) system of Hanwen Information.
According to the statistics of favorable deficit (exports minus imports), in 2023, Britain’s trade deficit was US$ 270.59 billion. Specifically, Britain’s trade deficit with the EU was US$ 100.23 billion, and its surplus with Switzerland was US$ 21.82 billion.
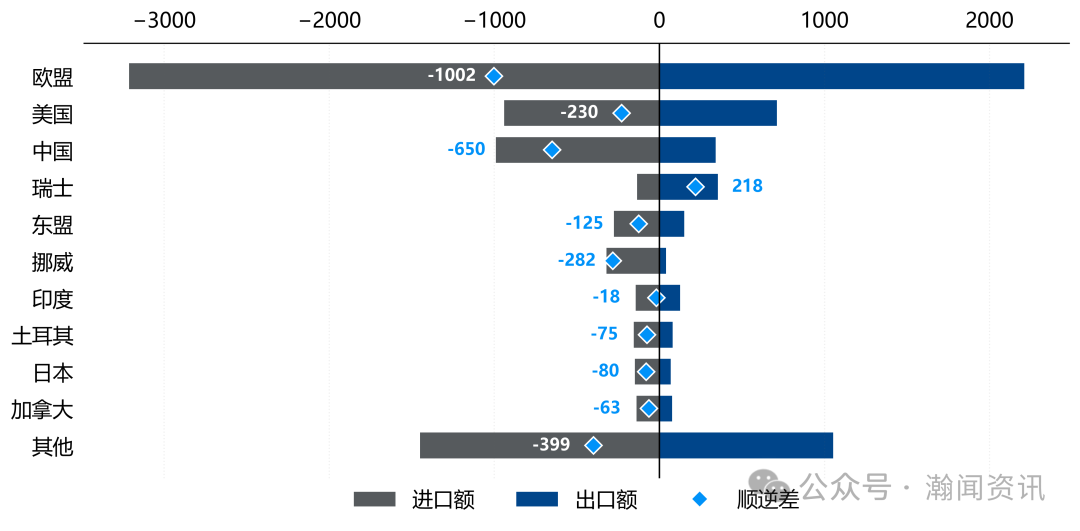
Figure 5 Major trading partners and trade balance of Britain in 2023 (US$ 100 million)
Data sources: Eurostat (198801-201912), HM Revenue & Customs (202001-), Global Trade Watch (GTF) system of Hanwen Information.
2.1. Inlet side analysis
According to partner statistics, in 2023, Britain’s top three trading partners imported from the world were the European Union, China, the United States, etc. Among them, Britain’s imports from the European Union were the largest, amounting to 321.27 billion US dollars, up 4.6% year-on-year; Imports from Kazakhstan had the highest growth rate, amounting to US$ 14.28 billion, up 86.0% year-on-year; Overall, among the top 10 partners, 3 have maintained a year-on-year growth rate.
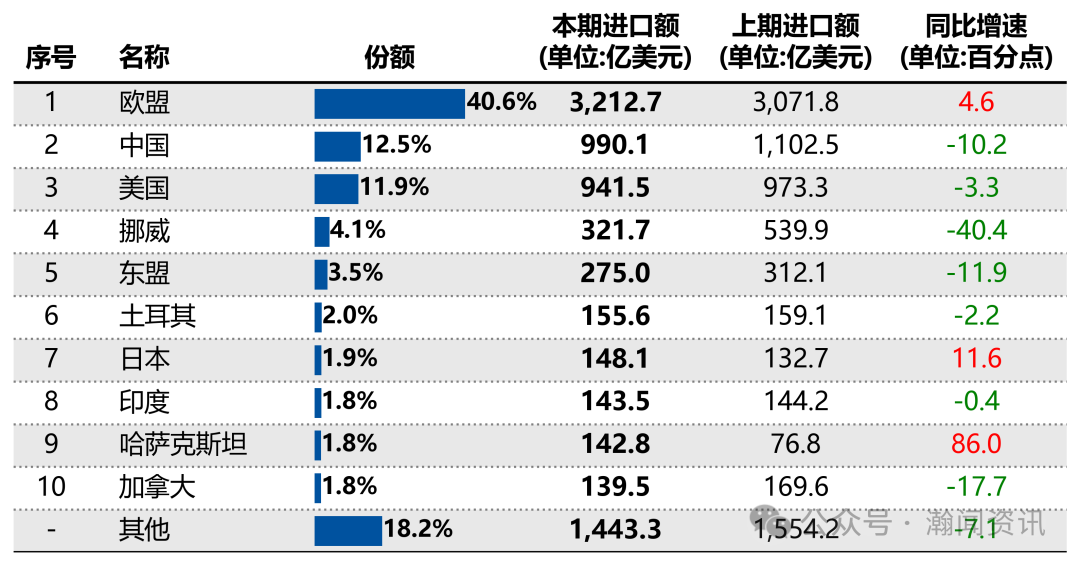
Table 1 Top 10 trading partners of UK import value in 2023
Data sources: Eurostat (198801-201912), HM Revenue & Customs (202001-), Global Trade Watch (GTF) system of Hanwen Information.
According to the pulling degree, British imports from Norway dragged down the overall growth rate by 2.6 percentage points, imports from the European Union dragged down the overall growth rate by 1.7 percentage points, and imports from China dragged down the overall growth rate by 1.4 percentage points. (Note: The pull here is the ratio of the change of import amount from this trading partner in this year to the total import value in the same period of last year. ) In terms of share, the EU, China and the United States account for 40.6%, 12.5% and 11.9% of Britain’s total imports respectively.
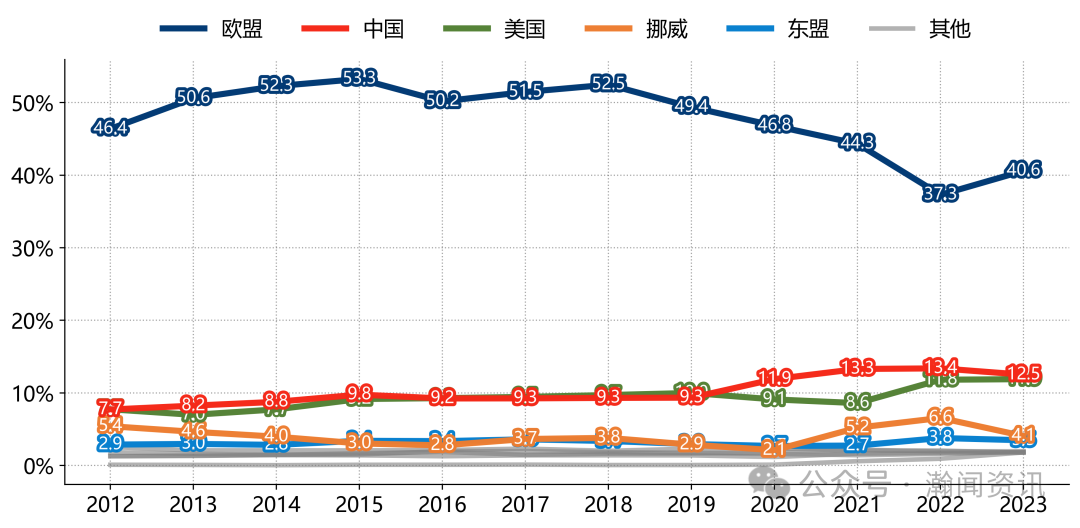
Figure 6 Changes of import share of major trading partners in the UK in December 2012-2023
Data sources: Eurostat (198801-201912), HM Revenue & Customs (202001-), Global Trade Watch (GTF) system of Hanwen Information.
According to the statistics of commodities (categories), in 2023, the top three categories of British imports from the world were "mechanical and electrical products (chapters 84-85)", "transportation equipment (chapters 86-89)" and "mineral products (chapters 25-27)", among which "mechanical and electrical products (chapters 84-85)". "Transportation Equipment (Chapter 86-89)" has the highest growth rate, amounting to US$ 107.92 billion, up 27.6% year-on-year; Overall, among the major categories, six have maintained growth year-on-year.
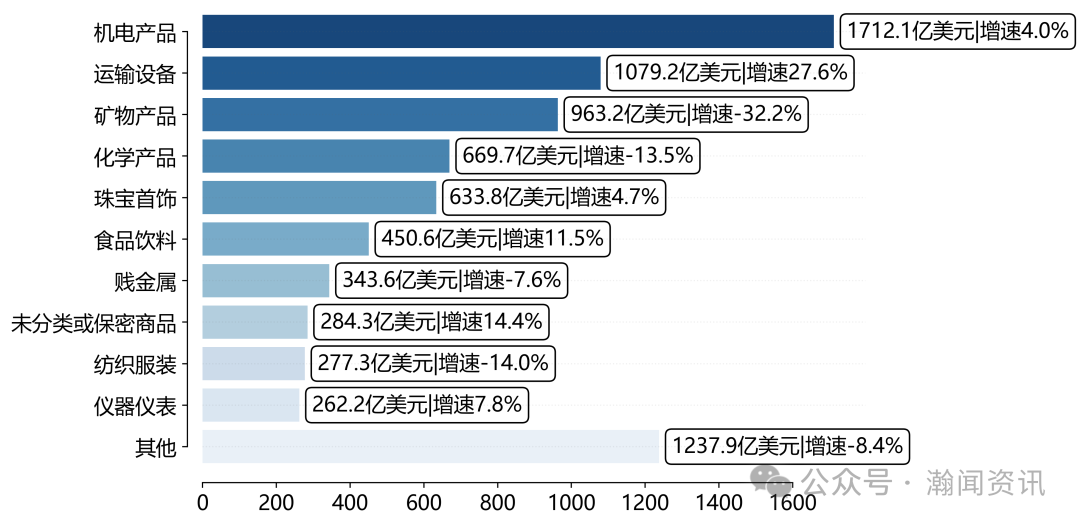
Figure 7 Major categories of UK imports from the world in 2023 (amount and growth rate)
Data sources: Eurostat (198801-201912), HM Revenue & Customs (202001-), Global Trade Watch (GTF) system of Hanwen Information.
In 2023, among the main categories imported by Britain, the EU accounted for 65.2%, 32.8% and 56.6% of "transport equipment (chapter 86-89)", "electromechanical products (chapter 84-85)" and "chemical products (chapter 28-38); China’s share of "mechanical and electrical products (chapter 84-85)" is 25.5%; The proportion of "mechanical and electrical products (chapter 84-85)" and "mineral products (chapter 25-27)" in the United States is 16.3% and 23.4%.
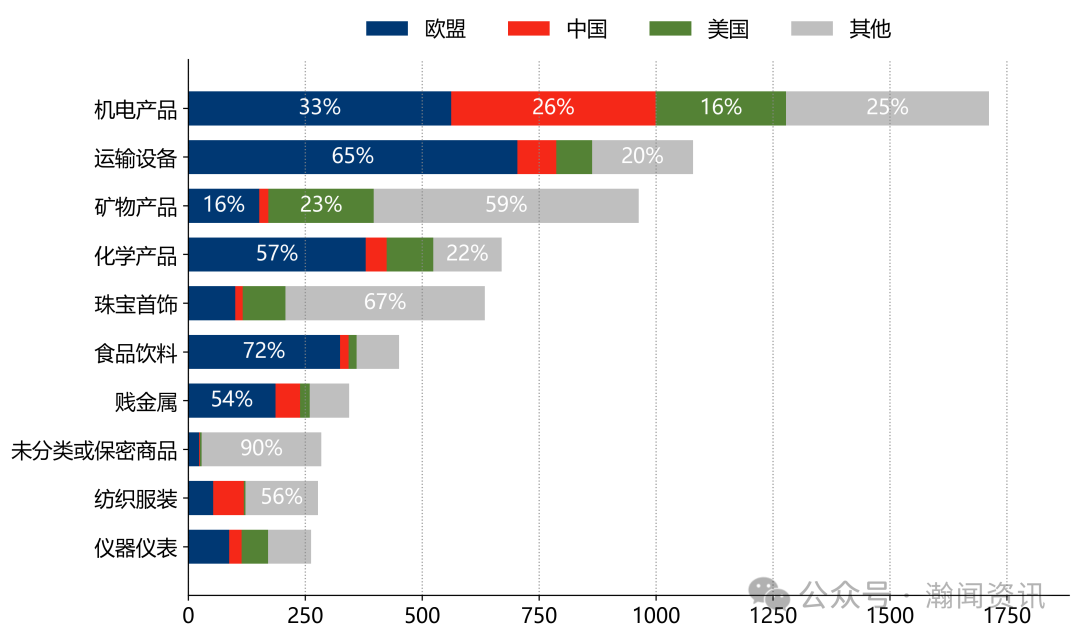
Figure 8 Structure of major categories imported from the world by Britain in 2023.
Data sources: Eurostat (198801-201912), HM Revenue & Customs (202001-), Global Trade Watch (GTF) system of Hanwen Information.
In 2023, among Britain’s main import partners, "mechanical and electrical products (chapter 84-85)" accounted for 17.5%, 44.2% and 29.6% in the EU, China and the United States; The proportion of "transportation equipment (chapter 86-89)" in the EU is 21.9%; "Mineral products (Chapter 25-27)" accounts for 90.9%, 23.9% and 4.7% in Norway, the United States and the European Union.
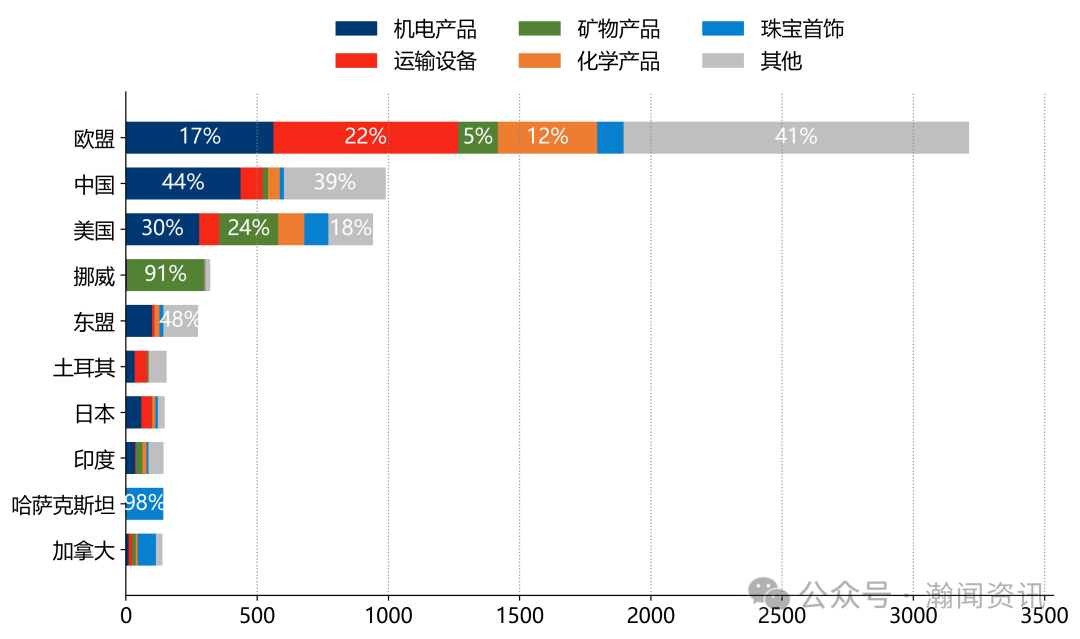
Figure 9 Structure of Britain’s main partners importing from the world in 2023
Data sources: Eurostat (198801-201912), HM Revenue & Customs (202001-), Global Trade Watch (GTF) system of Hanwen Information.
2.2. Export side analysis
According to partner statistics, in 2023, Britain’s top three trading partners in global exports were the European Union, the United States, Switzerland, etc. Among them, Britain’s exports to the European Union were the largest, amounting to US$ 221.04 billion, down 6.5% year-on-year; The export growth rate to India was the highest, amounting to US$ 12.52 billion, up by 28.7% year-on-year; Overall, among the top ten partners, 6 have maintained a year-on-year growth rate.
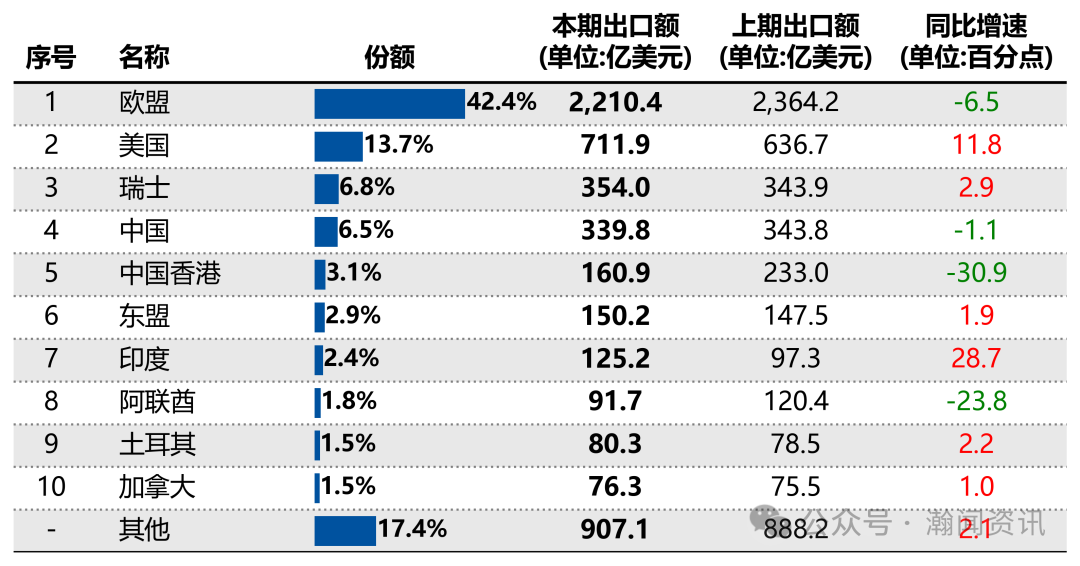
Table 2 Top Ten Trading Partners of UK Export Value in 2023
Data sources: Eurostat (198801-201912), HM Revenue & Customs (202001-), Global Trade Watch (GTF) system of Hanwen Information.
According to the degree of pulling, British exports to the EU dragged down the overall growth rate by 2.9 percentage points, exports to the United States by 1.4 percentage points, and exports to Hong Kong, China by 1.4 percentage points. (Note: The pull here is the ratio of the change of export amount to this trading partner in this year to the total export value in the same period of last year. ) In terms of share, the EU, the US and Switzerland account for 42.4%, 13.7% and 6.8% of Britain’s total exports respectively.
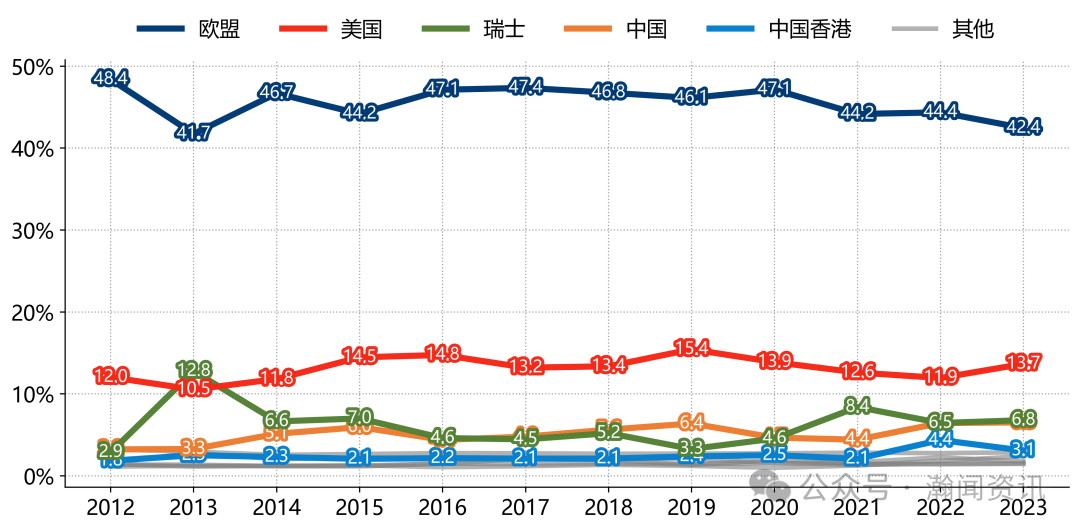
Figure 10 Changes in the share of major trading partners in UK exports in December 2012-2023
Data sources: Eurostat (198801-201912), HM Revenue & Customs (202001-), Global Trade Watch (GTF) system of Hanwen Information.
According to the statistics of commodities (categories), in 2023, the top three categories of British exports to the world were "mechanical and electrical products (chapter 84-85)", "jewelry (chapter 71)" and "transportation equipment (chapter 86-89)", among which "mechanical and electrical products (chapter 84-85)" was the largest. "Transportation Equipment (Chapter 86-89)" has the highest growth rate, amounting to US$ 67.10 billion, up 20.3% year-on-year; Overall, among the major categories, five have maintained growth year-on-year.
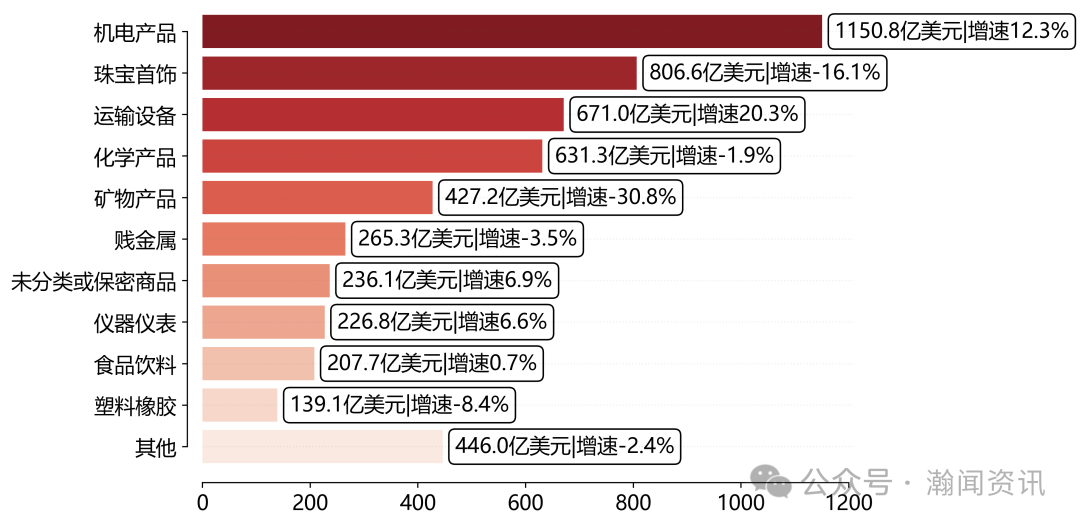
Figure 11 Major categories of British exports to the world in 2023 (amount and growth rate)
Data sources: Eurostat (198801-201912), HM Revenue & Customs (202001-), Global Trade Watch (GTF) system of Hanwen Information.
In 2023, among the main categories exported by Britain, the EU accounted for 41.7%, 80.6% and 49.6% of "mechanical and electrical products (chapter 84-85)", "mineral products (chapter 25-27)" and "chemical products (chapter 28-38); The proportion of "mechanical and electrical products (chapter 84-85)", "chemical products (chapter 28-38)" and "transportation equipment (chapter 86-89)" in the United States is 16.9%, 24.3% and 17.1%. Switzerland’s share in "Jewelry (Chapter 71)" is 37.7%.
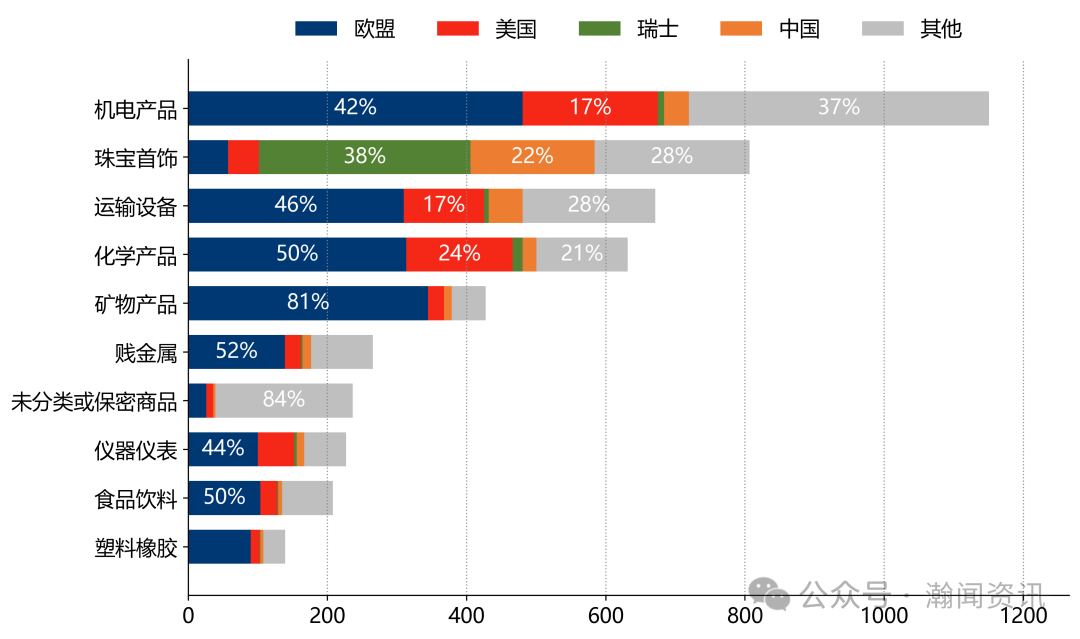
Figure 12 Structure of major categories of British exports to the world in 2023.
Data sources: Eurostat (198801-201912), HM Revenue & Customs (202001-), Global Trade Watch (GTF) system of Hanwen Information.
In 2023, among the main export partners of Britain, "mechanical and electrical products (chapter 84-85)" accounted for 21.7% and 27.3% in the EU and the United States; "Jewelry (Chapter 71)" accounts for 85.8% and 52.4% in Switzerland and China; "Transportation Equipment (Chapter 86-89)" accounts for 14.0% and 16.2% in the European Union and the United States.
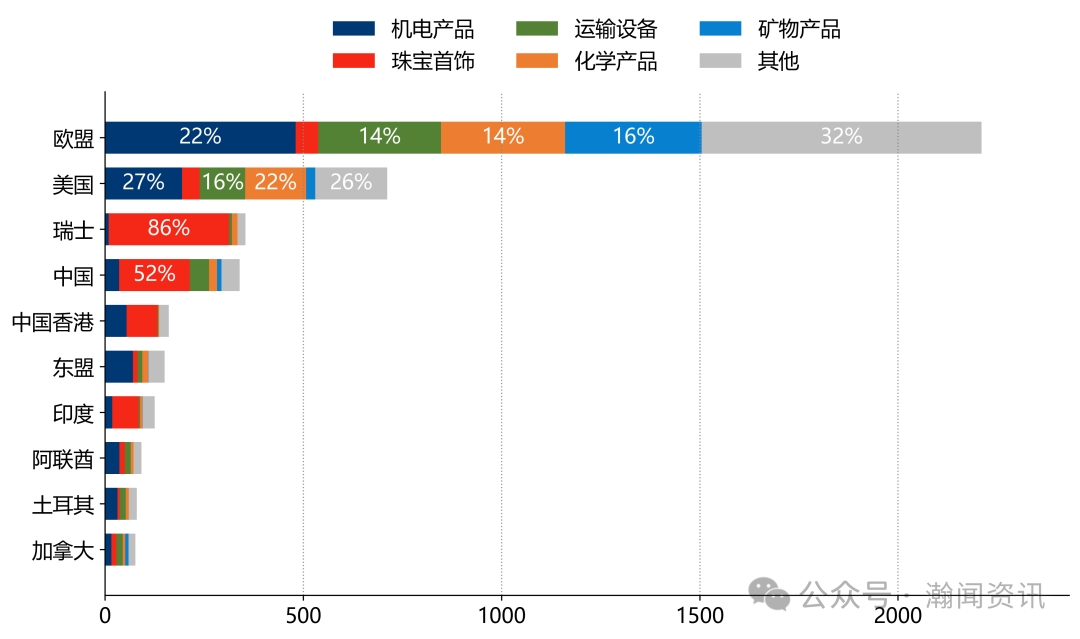
Figure 13 Structure of Britain’s main export partners to the world in 2023
Data sources: Eurostat (198801-201912), HM Revenue & Customs (202001-), Global Trade Watch (GTF) system of Hanwen Information.
3. Short-term forecast
Based on the historical trend analysis of UK’s import and export amount, without considering external factors, the forecast of UK’s import and export amount in the next three months is US$ 103.529 billion, US$ 104.022 billion and US$ 114.304 billion respectively, with a year-on-year decrease of 0.8%, 1.4% and 2.0% respectively. (Note: Prophet is an open source library developed by Facebook(META) for time series prediction. Prophet model is a time series prediction method based on additive model, which combines trend, seasonality and holiday effects to model and predict time series data. It should be noted that the Prophet model is a statistical method, which assumes that time series data has certain regularity and predictability. )
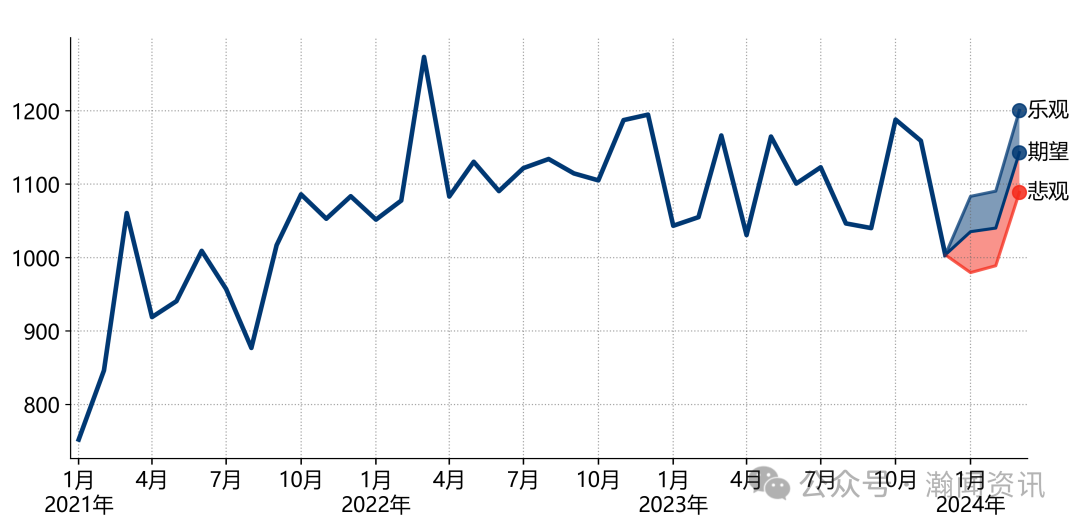
Figure 14 Analysis and forecast of the trend of UK’s total import and export value from 2021 to March 2024 (USD 100 million)
Data sources: Eurostat (198801-201912), HM Revenue & Customs (202001-), Global Trade Watch (GTF) system of Hanwen Information.
(Author: Han Wen Information This article has nothing to do with the position of Peking University Regional and National Research Institute, and it is at your own risk. Please indicate the author’s information and the source of the article when quoting or reprinting. )